


Like most people, I use the internet a lot in the evenings when I have some downtime. Although I live in the centre of European capital city (Dublin) which ought to be fairly weIl served with cell tower coverage, I also happen to live in an old house with 12 inch thick poured concrete walls. Getting good a connection for voice calls has never been guaranteed, so I wanted to check how well some major brand’s web presences would fare under my particular set of circumstances on a mobile network connection.
I included several sites that have specific mobile web presences as well as sites which take a responsive approach. I also extended my connectivity modeling to cover various everyday connectivity conditions I encounter. Namely; at home, on public transport, at the office, out and about. Finally, I measured payloads for a series of 4 devices ranging from desktop to smartphone to feature phone. In summary, I’m looking at a mix of sites (3 responsive and 3 mobile specific), 4 devices, and 4 different connectivity models.
To make sense of the results, I also included measurements for Google.com, as a kind of gold standard of a company that is very conscious of speed of user experience. For more on just how much effort Google puts into this, check out the article Anatomy of a mobile web experience – Google.com .
Initial Page Weight Load
I looked at a mix of sites from different industries, from technology companies to consumer services and media.
The sites I tested were:
- microsoft.com (RWD)
- nokia.com (RWD)
- cisco.com (RWD)
- ibm.com (specific mobile site)
- tripadvisor.com (specific mobile site)
- nytimes.com (specific mobile site)
Benchmark: google.com (specific mobile site)
I used a combination of Chris Pederick‘s Webmaster and User Agent Switcher tools to measure the weight of initial page loads for the different sites. The user agent switcher was used to measure page weights served across a range of different devices from high to low end. The measurements of assets sent were performed at the same time. Cache was cleared and all cookies deleted before each measurement was taken. The following are the device types that I tested:

|
 |
 |
 |
| Desktop | iPhone | Xperia T |
Nokia 6300 |
Here’s how the sites fared across the spread of different devices tested. The scale on the left is in kilobytes served.
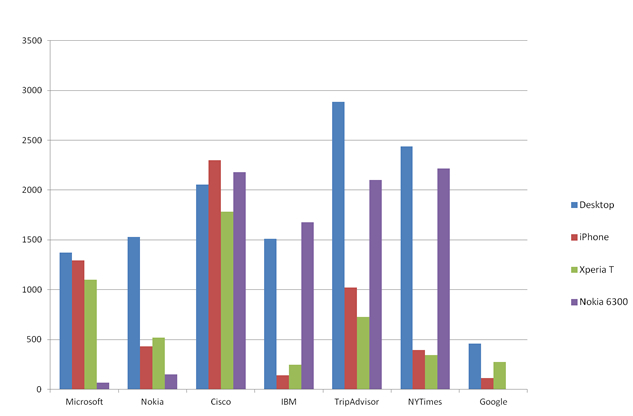
As you can see, there is a wide variance between how the page weight altered between desktop and low end devices. In the case of Microsoft and Nokia, the page weight decreases markedly as you step down screen size. In the case of Microsoft, the low end Nokia feature phone is directed to a specific mdot site as opposed to serving the responsive site to that device. Nokia’s site manages a simple degradation of page weight without resorting to a separate URL. Both companies appear to have a web strategy that spans multiple device classes. However Nokia does a much better job of optimizing page weights for mobile.
Cisco on the other hand serves a similarly weighty payload to every device. A classic RWD implementation letting all the adaptation happen client side for all devices. There is no attempt made to lighten the load for older non-touch enabled devices like the Nokia 6300.The difference between this and Nokia’s approach effectively highlights the value of using RESS.
IBM serve a dedicated mobile site to handsets, but not to the Nokia device which is sent the entire desktop site. TripAdvisor and the New York Times are similar in that they adapt content heavily for mobile, but it appears the strategy does not include a specific experience for simpler devices. So if you own an feature phone, you are at a disadvantage on these companies’ sites.
Perhaps the thinking is that these older devices don’t matter, but you may not know that unless you are using device detection as many analytics packages (free ones anyway) tend to rely on Javascript to identify devices. Also worth noting that there are at least 1.5 billion Series 40 devices out there already.
As expected, the gold standard Google outperforms all these sites in terms of initial page weight, because (a) it’s a relatively simple page but also because (b) they take optimization very seriously indeed.
Update: It is interesting to note that both IBM and Tripadvisor appear to not be detecting Nokia 6300 correctly and hence serve a desktop page to this device. Further testing with a comparable device (Motorola L7) shows that both IBM and Tripadvisor serve a lightweight page to the Motorola L7, but not to the Nokia 6300. The NYTimes.com still served the desktop site to the Motorola L7.

Lightweight Tripadvisor site not served to Nokia 6300
Connectivity Conditions and Testing
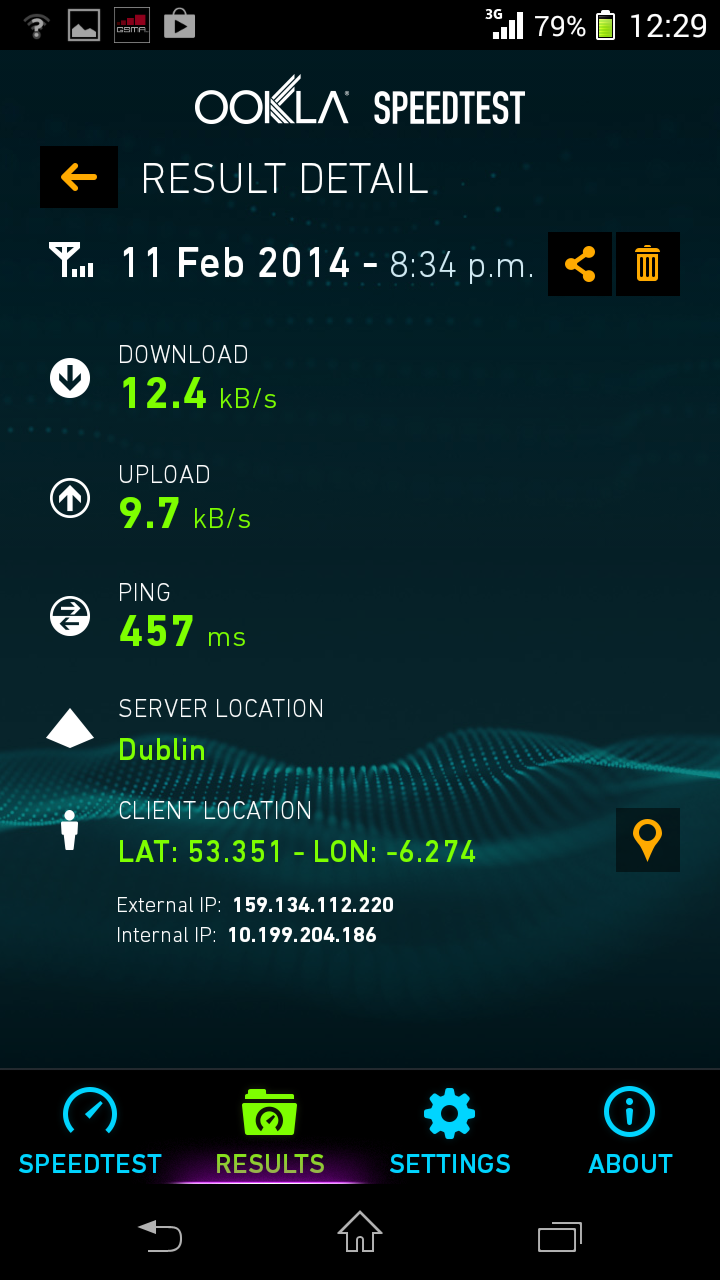
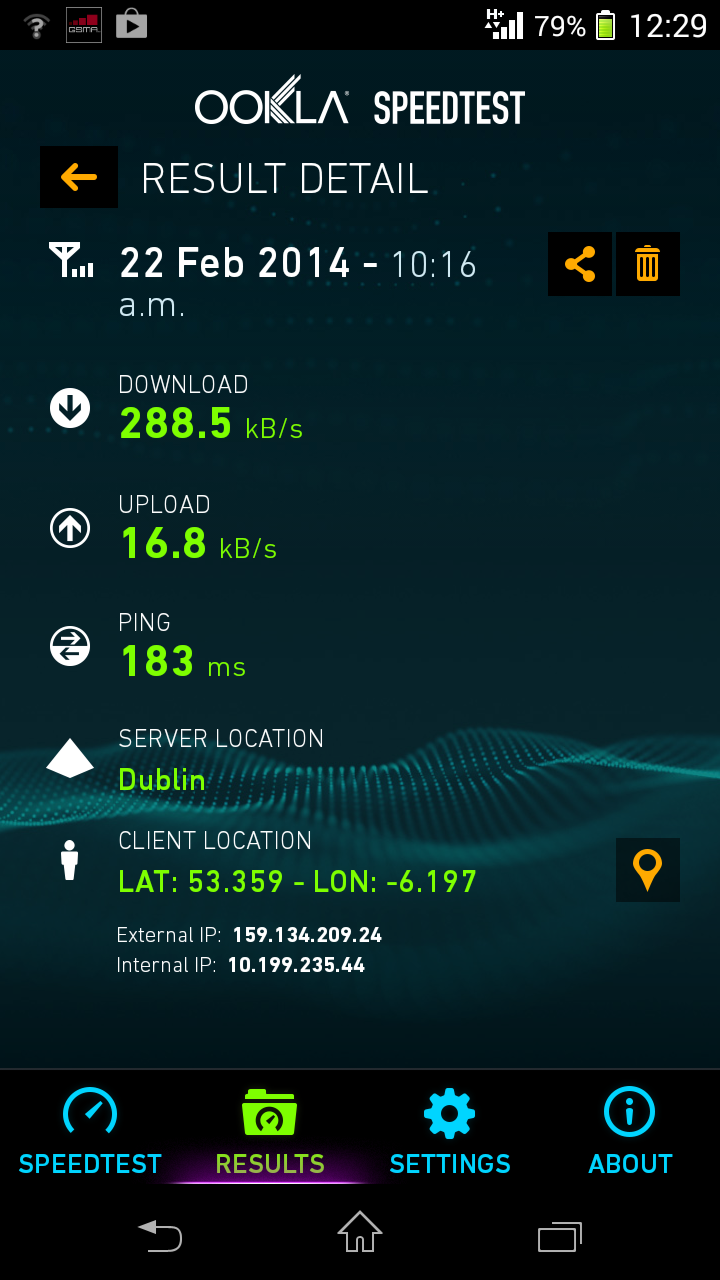
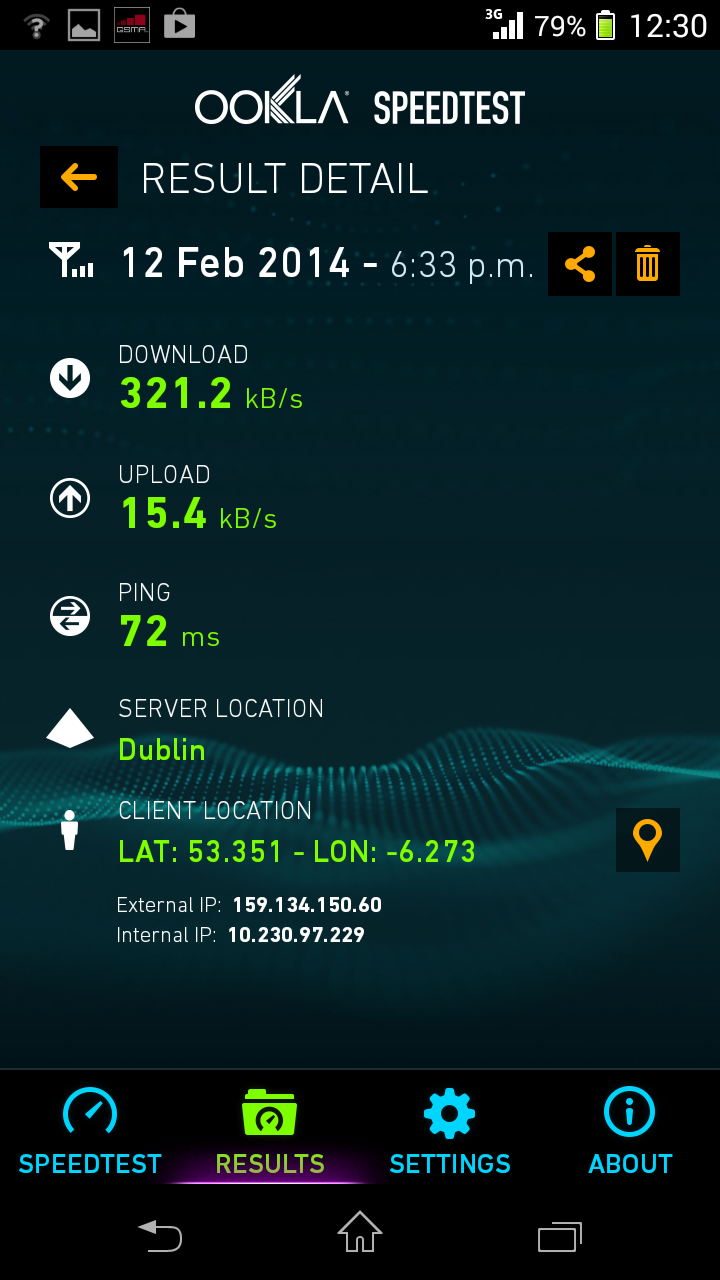
I used Ookla’s speedtest app installed directly onto my device to measure connection speeds for conditions set out above. The device in question is a Sony Xperia T, a mid to high range Android running Jelly Bean (specs here via DeviceAtlas). Here are the results of the speed tests which range from office WiFi on the high end of the spectrum to an EDGE connection in my modest but sensibly built home:
 |
 |
 |
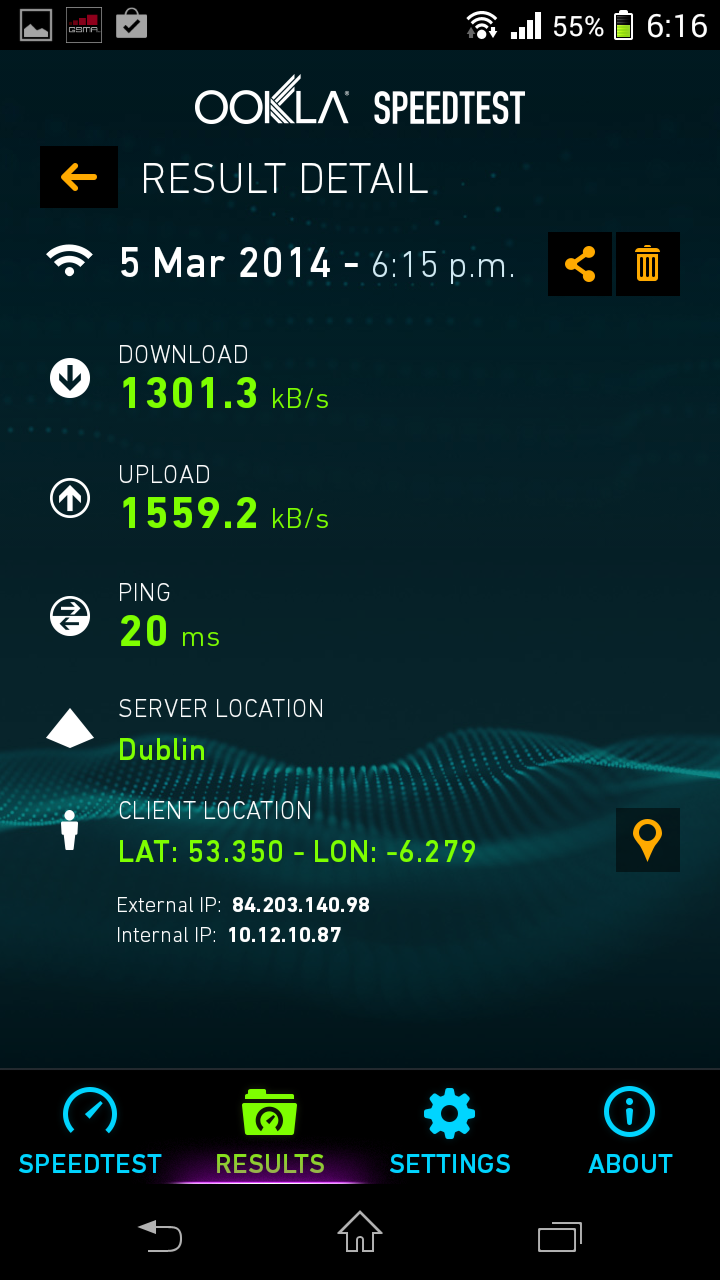 |
| At home EDGE | 3G On Bus | HSPA in Financial District | WIFI in Office |
Taking the results of the speed tests to derive an initial load time for initial page loads on the Sony Xperia T in seconds for each of these sites, we get the following set of results. A generally accepted rule of thumb is that users will not wait longer than 3 seconds for a site to load before abandoning it. I’ve highlighted anything above the 3 second mark in red.
| Microsoft | Nokia | Cisco | IBM | TripAdvisor | NYTimes | ||
| EDGE | 88.7 | 42.0 | 143.7 | 19.9 | 58.8 | 27.9 | 22.3 |
| 3G | 3.8 | 1.8 | 6.2 | 0.9 | 2.5 | 1.2 | 1.0 |
| HSPA | 3.4 | 1.6 | 5.5 | 0.8 | 2.3 | 1.1 | 0.9 |
| HSPA+ | 1.9 | 0.9 | 3.1 | 0.4 | 1.3 | 0.6 | 0.5 |
| WIFI | 0.8 | 0.4 | 1.4 | 0.2 | 0.6 | 0.3 | 0.2 |
Table 1: Wait times in seconds for initial page loads for each connectivity scenario with a Sony Xperia T
Essentially, none of these sites work well on an EDGE connection. Cisco’s will even struggle on 3G and HSPA connections. The load times are just too long. For lower spec’d devices it is likely that this scenario would be even worse, with red spilling well into the 3G row at least. So how much does it matter that this is the case?
Today’s connectivity patterns
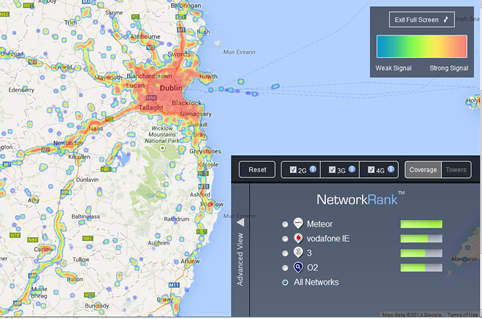
While there is a widespread cellular communication coverage, there is plenty of anecdotal evidence of variable connection speeds. Although I am theoretically in a well served area on the best ranked network according to opensignal’s network rank for Dublin, the physical fabric of the built environment gives the lie to this picture.
If connectivity can be compromised in an urban location with a well developed network infrastructure, then it certainly gives pause for thought as to how big the cumulative effect of poor connectivity coupled with heavy sites is across other major urban centres around the world. How many site visitors simply move on when they can’t connect to a weighty site on their available connection?
How is this likely to play out in more rural settings? What about less developed countries? To take a more global view on this, consider that there were 6.8 billion mobile cellular subscriptions (phones and broadband) worldwide at the end of 2013 which represents a 96% penetration. How many potential eyeballs does that add up to who are not able to engage with web content at least some of the time? It potentially runs to billions in lost revenues.
| Worldwide Broadband Subscribers | 2013 a,b |
|---|---|
| World population | 7.1 billion |
| Fixed broadband | 9.8% |
| Developing world | 6.1% |
| Developed world | 27.2% |
| Mobile broadband | 29.5% |
| Developing world | 19.8% |
| Developed world | 74.8% |
| a Per 100 inhabitants. b Estimate. |
|
| Source: International Telecommunications Union | |
It is also worth remembering that although smartphones have eclipsed feature phones in terms of device shipments, that there are still millions of feature phones being shipped and used around the world.
Ultimately companies who have an international focus will do well to factor in the real world connectivity concerns to their web strategies. Connectivity constraints may be difficult to design for, but optimizing sites according to different connectivity conditions is something that is within the control companies publishing web content, even if guaranteeing network speeds isn’t.
Notes
One caveat on the method we used to derive load times (dividing page weights by connection speeds), is that it does not take into account the effect of the TCP/IP slow start algorithm, which would add an additional overhead to speed of load times. This means that the wait times in table 1 represent a ‘best case scenario’ for the recorded connection speeds. These wait times would be even slower in live conditions.


Leave a Reply