The latest DeviceAtlas Mobile Web Intelligence Report explores statistics for smartphone usage around the globe.
Feature phones
The data showed that 13% of all traffic from feature phones came from devices released in 2011. Of the rest, those released in 2005, when Nokia was king of the hill, were responsible for a disproportionately high volume of traffic, implying these older devices aren’t all necessarily sitting unused in kitchen drawers.
Recent marketing initiatives by Reliance Jio, India’s third largest operator, caused a massive spike in feature phone usage. KaiOS is now the second most used OS, at Apple’s expense.
Mobile operating systems
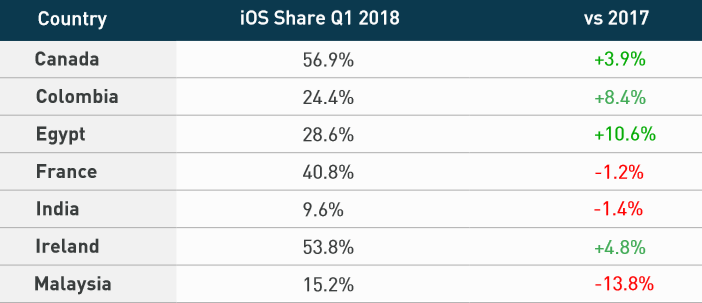
More bad news for iOS in Malaysia, where Android gained 13% market share, causing iOS to drop a similar amount.
iOS gains in Egypt, Colombia, Canada and Ireland were offset by losses in France and India.

Android still dominates in non-English speaking countries, while iOS is favoured by Anglophones, Swedes, and also in Japan, where a massive 68.33% of smartphone users opt for an Apple device.
Most active bots and crawlers
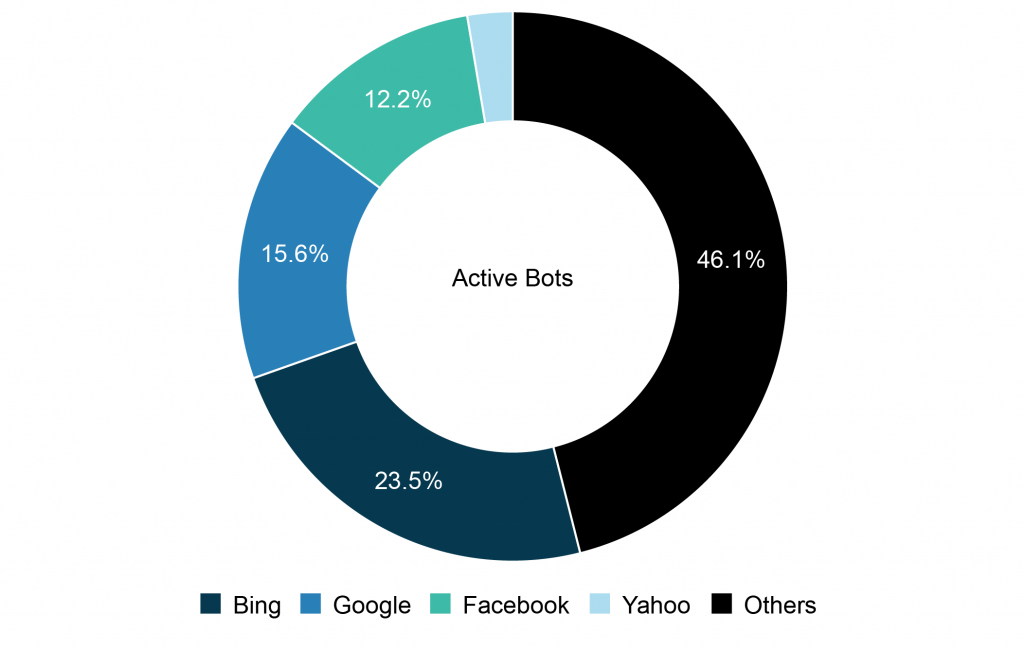
BingPreview was the most active bot we saw in Q1 2018, accounting for almost 10% of total bot traffic included. This was followed closely by Facebookexternalhit, another page preview tool, with 8%.
Google’s mobile crawler is next with 5.5%, then Yahoo’s Slurp with 2.6% of bot hits in our data. The report highlights all the top bots and provides the user agents you might expect to see in your logs.

RAM and screensize
4GB usage increased in all countries in our study, excluding Malaysia where 2GB still commands 30% of the market. 2GB proved most popular in all countries but Egypt, Argentina, Brazil and Colombia, where 1GB still rules the roost.
In terms of screen size, the popularity of the iPhone 6 and 7 ensures 750×1334 remains the most seen in our data.
720×1280 and 1080×1920 make up the bulk of the traffic. You can see the top screen sizes broken down by country in the full report, which you can download here.


Leave a Reply