


Regular contributors to DeviceAtlas will hopefully already know what TA-DA is, but in case you need a refresher class, you can have a quick glance at a few of these pages if you want.
Back? Good.
TA-DA currently has a relatively modest collection of 42 tests, ranging from simple properties such as “can you see this image”, to more complex such as the audio and video streaming tests. With work ongoing on the introduction of more tests (like JS and CSS support for example – but let’s keep that between you and me for now) at the moment, I’ve taken some time out to look over a few stats and I’d like to report some of them back to you now!
Top 10 Users
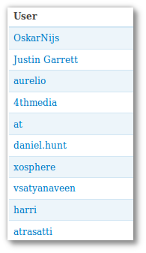
Something I feel obliged to disseminate, is our list of most active TA-DA users. As you can see from the image just to the right, I’ve pulled out the top 10 TA-DA users, a rather interesting little piece of information.
Our very own Andrea Trasatti just barely makes it into the top 10 list, and even yours truely gets a mention, but the 2 of us combined just barely come close to the happy tapper Justin Garrett (of Candyspace Media Ltd), and we’re positively eclipsed by the overactive TA-DA addict that is Oskar Nijs (from MoMac GoMedia). Keep up the good work you 2, you’re the shining stars of device testing 🙂
Latest Tests
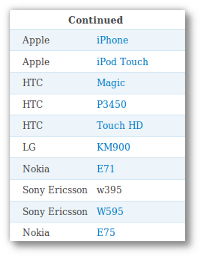
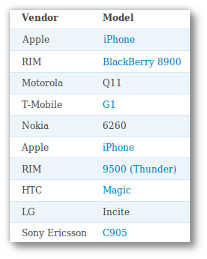
A quick snapshot of the latest test sessions completed is next, which shows you, well, admittedly not much at the moment, but we use this list to keep track of what’s happening on TA-DA at any point in time.
As some of you will probably wonder, the devices in black (ie, that are not linked, like the blue ones) are ones that we couldn’t identify when the test session was started. That said, thanks to the efforts of these people we’ll be able to identify them in the very near future – or at least as soon as our data-mining hamsters verify the data 🙂
A Graph!
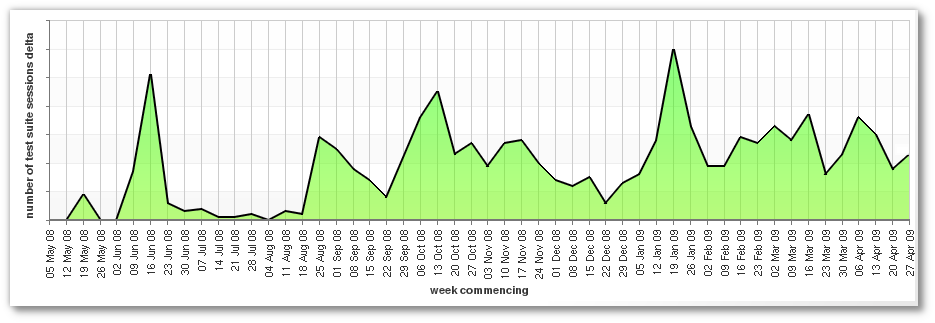
Finally there’s the obligatory graph to look at (click to enlarge). This wouldn’t be much of a post without a graph, so here’s one that shows the relative number of new TA-DA test sessions, broken down by week. Due to inevitable wrist slapping, I’ve removed the actual figures from the graph, but even without this information you can immediately draw a few interesting facts from it.
Around the time of development there was a small start to the data, but after the inital announcement that TA-DA was released there was a huge surge in sessions-per-week. As the system was still in beta during July and August the traffic levels weren’t particularly awe inspiring, but the feedback we got was vital, as it was the first time that non-dotMobi developers got a look at the system.
When the 2.0 preview of DeviceAtlas was announced, with the addition of 5 new tests, traffic jumped up again. While it did start to fall back down again, compared to the beta release it was much more promising.
In September of 2008 I posted an article detailing how the advanced tests worked, which seems to have had some effect on the weekly test session creates, which climbed until mid October.
Creates seemed to drop down after that, lifted slightly by the talk I gave at Drupal Ireland Meetup 2008 in November, and (I like to believe) to a lesser extent the talk I gave in Trinity College in December.
The Christmas slump led to a predictable nosedive in the stats during the leadup to the December holiday season, where it veered sharply towards the bottom of the graph.
Then January came along. On the 19th of January we announced the inclusion of a whole raft of new tests (and properties in DeviceAtlas too), centering mainly on the new audio/video streaming capability tests. Test session creates literally exploded that week, and I’m happy to see that all the work that went into it was (in some way) rewarded.
Unfortunately, that traffic level wasn’t maintained, but the spike alone shows that there’s still considerable interest in device detection, optimisation and testing.
The traffic levels between the start of February and now have fluctuated a bit, but have stayed inside a rough boundary so I’m happy enough with that.
What’s next for TA-DA? Well I’m slightly hoping that this post rekindles your desire for all things device testing, and you suddenly feel compelled to head on over to the site with a box of mobile phones and a few minutes to spare 🙂
Every time you enter data into TA-DA you’re helping yourself, others and us. Your test sessions validate or correct data we already have, or fill our database with new exciting devices or device headers!
So go out there and beg, borrow or steal your friends’ phones, and plug in http://ta-da.mobi to see what happens. Why waste time avoiding eye contact with strangers on the bus/train/rickshaw when you could be happily bouncing through the test suite? Besides, TA-DA is much more enjoyable than reading a free paper, paid for by advertisements on every second page, eh? 🙂
If you’re still wondering why you should contribute to TA-DA, and through it, DeviceAtlas, take a look at the Becoming a Data Partner page on DeviceAtlas.
When I gather some more interesting stats I’ll be sure to post up here again. And if any of you have information, thoughts or comments on device testing, feel free to post here.
Daniel


Leave a Reply