It used to be so easy. Measuring the weight of a web page in the early days of the web was merely a matter of waiting for the page to finish loading and then counting up the size of its constituent resources.
Since then, however, a lot has changed. The web is inexorably moving from a web of documents to a web of applications, powered by JavaScript and HTML5, significantly complicating the job of measuring page weight. There is a surprisingly small amount of research is out there on this important topic. This article will talk about ways to measure page weight in a world of mobile devices and rich app-like sites.
Note: This article is part II of a three part series on page weight. Part I: Understanding page weight
What does page weight even mean?
One outcome of the seachange in web publishing is that there isn't really an accepted definition of what page weight even means anymore.
A page may load its initial linked resources quite quickly but what happens next is now completely open-ended—JavaScript is Turing-complete language after all. Take Gmail as an example: the initial page loads quickly but the page is essentially empty. After the initial page load Gmail becomes a full-blown JavaScript application that just happens to render its interface in the DOM and keeps open a connection to the server, just as a native binary email application might. Thus any measurement of page weight is somewhat arbitrary since you have to choose a cutoff point after which subsequent communications are not considered to be related to the initial page load.
Another factor adding to the confusion is that measured page weight is increasingly likely to vary by device and/or screen size—there is no longer a single canonical view. A combination of server-side device detection, context-sensitive HTML tags and client-side scripting mean that resources such as images can be selectively chosen to suit the device in question e.g. an image that suits the particular device's screen resolution rather a one-size-fits-all version.
Finally, as embedded third-party components increase in scope and power, a further layer of variability is added to the page weight:
- Ads (which can be based on almost any factor including browsing history, device type, location, sex)
- Social network widgets and whether you have an account and are logged in
- Third-party cookie support and Do Not Track (DNT) header configuration
- Browser type
- First visit vs. repeat visit
These embedded components are often loaded in iframes meaning they they are technically entirely different pages, but their impact is certainly felt. Taking all of these changes together, page weight testing has become quite complex so we decided to run a series of tests to check how the various tools fared.
Page weight testing results
To test how well some common measurement tools work, I made a series of pages of increasing complexity, starting from a pure HTML page with no styling or images, all the way up to a styled page with AJAX-loaded images, iframes and web sockets. You can find these pages on GitHub or hosted here.
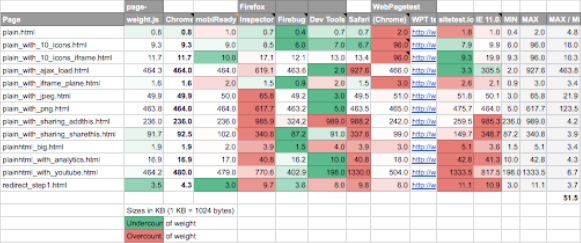
We ran these test pages through many of the browser and web-based testing tools. You can see the results in this public Google Sheets document. The test results are coloured green or red depending on whether the tool under- or over-counted the page weight relative to Chrome. Chrome was used as a reference because, based on a manual count of the resources in each page, it always returned the correct result. The WebPagetest test result links have been included for completeness.

Testing page weights with different tools.
There are several interesting aspects to note. First of all, note that almost every tool both under- and over-counts depending on the type of page under test, a worrying start.
Next, note the vast spread of results. The average factor between the smallest and biggest results across the test data is 52. Even on the simplest of pages the ratio between the maximum and minimum measure weights is almost five. To be fair, many of the discrepancies are due to different approaches: WebPagetest includes favicons, some tools don’t; sitespeed.io can optionally be configured to use a local browser to get more accurate results. But clarity is still lacking and many tools are egregiously incorrect, even on simple pages.
The lesson here is that quoted page weights should be treated with some skepticism since there is almost no agreement between the most popular tools, and most tools are making significant mistakes. We need to start asking how weights were measured.
A proposed standard for page weight
In Sèvres, a suburb of Paris, the Bureau International des Poids et Mesures keeps a precisely sized lump of metal under three concentric glass covers. This cylindrical ingot, composed of platinum and iridium, precisely defines what a Kilogram is.

The perfect Kilogram in Paris, fittingly protected by thee concentric cheese covers
Ironically it turns out that, like our World Wide Web, the reference Kilogram is gaining mass despite the triple cheese covers. Or possibly it is loosing mass, no one can be sure—all that is known is that it is different than it used to be. Scientists are thus sensibly trying to define mass in terms of some fundamental physical property (like the other SI units of measure) rather than an arbitrarily-chosen amount of metal. You can read more over at the Economist: Is Paris worth a mass?
Clearly we need a better reference for web page weight, one that is equally carefully specified. To do this we need to start by defining what exactly page load means. Our current lack of a standard makes web page measurement as arbitrary as defining length by referring to the reigning monarch’s arm. Browsers already fire a DOMContentLoaded event when they consider all initial elements to be loaded. But this event fires when all of the standard linked resources are loaded i.e. items such as images and other media that are linked with standard HTML tags and thus misses much of what constitutes today’s web.
A better definition of page load for today’s web needs to be more precise than it has been, and should include the following elements:
- the contents of iframes defined on the page
- requests initiated by JavaScript related to page load
Since there isn’t a natural end to any JavaScript-initiated network activity, a cutoff point is required. We propose that a delay of 5 seconds after the initial DOMContentLoaded event is enough to capture most activity related to page load without including too much spurious data. This additional time can make a really big difference in measured weight:
$ node page-weight.js http://boingboing.net 0
Page loadEvent fired after 1.8 seconds, waiting 0 seconds for additional assets
TOTAL: 112 requests 2,867,932 bytes 2800.71 KB

$ node page-weight.js http://boingboing.net 5
Page loadEvent fired after 1.5 seconds, waiting 5 seconds for additional assets
TOTAL: 110 requests 3,526,896 bytes 3444.23 KB
$ node page-weight.js http://theguardian.com 0
Page loadEvent fired after 0.8 seconds, waiting 0 seconds for additional assets
TOTAL: 72 requests 298,985 bytes 291.98 KB

$ node page-weight.js http://theguardian.com 5
Page loadEvent fired after 0.9 seconds, waiting 5 seconds for additional assets
TOTAL: 107 requests 890,261 bytes 869.40 KB
Waiting an additional five seconds for assets to load added 23% and 197% to the page weight respectively, a really significant difference.
The second aspect that should be standardised is to specify what exactly is being counted and what is left out. We propose that all the over-the-air size of requests (i.e. compressed size if GZIP or deflate used) plus the response headers are counted, since this most closely tracks the cost in time and bandwidth to the user. To report anything else just isn’t meaningful.
At the very least, page weight testing tools should be transparent in what they measure by answering the following questions:
- Does the tool measure the over-the-air size of resources or the result once fetched?
- Are response headers included?
- Is the page’s favicon.ico’s included?
- Are the contents of iframes included?
- To what extent are JavaScript-initiated network requests counted?
So with that call for a standard aside, lets look into the details of how the popular tests tools fared. Despite the importance of measuring web page weight the tools available to measure it are feeling distinctly underdeveloped, insufficiently tested and misunderstood.
Browser-based measurement tools
The most obvious measurement tool at the disposal of developers is in the browser itself, since all modern browsers offer a rich set of tools for debugging and measuring.
Interestingly, there is very little consistency across the the browser-based inspectors—there is almost no agreement between them on page weight, even for the simplest of pages. That said, some of the differences between them are explained by taking a particular stance on what constitutes a request.
Starting at a basic level, the browsers report on individual requests and pages totals as follows:
| Browser | Single request | Page summary |
|---|---|---|
| Chrome | Reports “Size” and “Content” separately. Size is the compressed over-the-air byte size (if GZIP/deflate used) including response headers from the server. Content is the unpacked size of the fetched asset. |
Reports sum of Sizes |
| Firefox | Reports Size as the unpacked size of the fetched asset, without headers. Bizarrely, in the case of binary assets such as images Firefox reports the size as the base64 encoded version of the asset, for unknown reasons, thus over-counting the real cost by about 30%. |
Reports sum of Sizes |
| Safari | Reports Size and Transferred. Size is the unpacked size of the fetched asset, Transferred is Size plus the size of the response headers from the server. |
Reports sum of Sizes |
| Internet Explorer | Reports Size and Transferred. Size is the unpacked size of the fetched asset, Transferred is Size plus the size of the response headers from the server. |
Reports sum of Sizes |
These reporting differences can lead to remarkably different size measurements, depending on the composition of the page. There is literally no agreement whatsoever between the browser tools thanks to their different approaches. In some cases the page size as reported in one browser can be as much as 100% higher than another one. As an example, a basic HTML page with ten small PNG icons resulted in page size measurements ranging from 6KB (Firebug) all the way up to 8.6KB (Chrome), a 43% difference. A simple page of 2,191 bytes of HTML/JavaScript with an AJAX-loaded image of 474KB resulted in a page sizes ranging from 464KB (Chrome, correct) all the way up to 619KB (Firefox, a 33% overcount) and a whopping 928KB (Safari, 100% overcount). Sitespeed.io includes the favicon.ico in page size calculations, which can significantly increase the measured size of small pages.
Web Developer Toolbar
Chris Pederick’s Web Developer Toolbar has been a popular tool with web developers for many years now. Unfortunately this tool makes two mistakes that render its page weight tests almost useless: it reports the uncompressed size of assets and leaves out response headers.
Firebug
Firebug was one of the first really rich developer tools, setting the standard for everything that followed. Firebug does report the over-the-air size of assets but leaves out response headers.
All of these approaches have some validity to them, depending on your point of view, but from the point of view of measuring the impact to users of page weight, the best metric is the over-the-air byte size, the true network cost of fetching the page assets. For this reason Chrome’s choice of reporting compressed payload (if GZIP/deflate used) plus the uncompressed response headers is the best one—all of the approaches used by the other browsers represent something a bit different, to the point that they are downright misleading in some cases.
Web-based Measurement Tools
There are a wide variety of web-based website measurement tools, each with a slightly different focus.


- WebPagetest. This is an open source project backed by Google that focuses on more on network aspects such as time to first byte and keep-alive rather than the constituent elements of a page. It is an excellent tool with installations in many countries and allows users to chose different (real) browsers to run the test on. WebPagetest also retains linkable reports and generates HAR files and screenshots. WebPagetest has a fully documented API making it a very useful tool for bulk analysis. One particularly nice feature of WebPagetest is how it measures both the first view page and repeat view page weights, an important aspect of performance.
- ready.mobi. This is our own tool and, as such, represents our own stance on the problem. Ready focuses on page weight and complexity, and usefully lets you know how you fare in relation to the Alexa 1000 sites. Ready can generate boss-friendly PDF reports and lets you create an account to track your site’s progress over time. Ready has a documented API for bulk testing. Much like WebPagetest, mobiReady also generates linkable reports.
- PageSpeed Insights. Another Google tool that gives a useful high-level sense of page performance. Unlike WebPagetest PageSpeed gives insights into CSS & image optimisation, and redirects. Overall page size is not mentioned.
- Pingdom Website Speed Test. Similar to WebPagetest, this tool focuses on the network aspects of performance, and also reports page size, load time and generates a HAR file. Pingdom gives a useful grade for 8 different aspects of page performance, though doesn’t take a stance on size in particular. One particularly useful aspect of their report is the “Size per Domain” section which is a useful way of seeing the costs of embedded ads and other widgets.
- Sitespeed.io. Another open source tool available for installation from npm or simple download. Unlike most of the tools here, Sitespeed’s default behaviour is to crawl beginning with the start URL and report on each page encountered. Sitespeed produces a really nicely formatted series of reports (in HTML, naturally) detailing the breakdown for each page.
PhantomJS deserves a special mention here due to its widespread use as a web testing tool. Multiple projects and libraries use Phantom as a headless browser for testing and measurement purposes e.g. casperjs, confess.
Unfortunately, PhantomJS has been incorrectly reporting page sizes since 2011, thanks to bug 10169, typically significantly under-reporting weights. You can verify this for yourself by running the included netsniff.js example on a page of a known size. This bug was not fixed in the recent 2.0 release. As a result, any tool that uses PhantomJS to measure page weight should not be trusted, though it may still be useful to measure relative sizes.
Page weight vs. journey weight
Traditional measures of page weight have focused on the weight of loading just the page under test. As content providers wrestle with the best way to publish to different devices it is not uncommon to find multiple redirects utilised in bringing the user to the final destination. Depending on how these redirects are implemented they can have a significant time and weight impact to the user.
Traditional HTTP 301 and 302 redirects are efficient from a payload point of view, typically costing only a few hundred bytes each but they introduce a significant time penalty, often as much as several hundred milliseconds each. This may not sound like much but, to put this delay in context, the web’s top performers (Google etc.) will finish loading and rendering in the time that some sites take merely to get the user to start loading the correct destination page. This really matters—the small repeated frictions of slow page loads eventually add up to users passing over links to your site. On 2G and 2.5G networks the round-trip latency is usually much worse, often leading to one-second redirect delays.
JavaScript and <meta> tag based redirects are significantly more impactful to the user than 30X redirects since some or all of the each page in the redirect journey needs to be fetched before the browser can even determine where to go next.
For this reason, we at dotMobi have chosen to start emphasising journey weight over page weight, defined as the total byte cost incurred in getting to and fetching the final page, including all redirects along the way. We utilise this approach in our page testing tool, ready.mobi.
Users of Chrome and Firefox can emulate this behaviour. In Chrome’s inspector, check the “Preserve log” checkbox. In Firefox you need to into the Developer Tools settings by clicking the little cog, then check the “Enable persistent logs” checkbox in the Common Preferences section.
Recommendations
Our recommendations for measuring page weight are as follows.
- If you want to use your browser, use Chrome. It’s the only browser that consistently the reports the correct page weight. Check the “Preserve log” checkbox if you want to measure the journey weight rather than page weight.
- Of the web-based test tools, only our own mobiReady consistently produces the correct results at the time of writing. WebPagetest gets things right almost all of the time but the occasional anomalous result is a bit worrying. That said, these will likely be fixed soon (we’ve reported the issue).
- Sitetest.io is a really nice locally-installed tool but pay attention to the wide range of options it offers—it can optionally use a locally installed Chrome or Firefox to get better results than the default PhantomJS.
Article series
1. Understanding web page weight
2. Measuring page weight
3. Reducing page weight


Leave a Reply