We always thought of DeviceAtlas as being more about device intelligence than merely device data. Being able to see and interpret patterns in the data helps developers make really smart design decisions, rather than just react, at run-time, to whatever turns up at their site.
So we've been putting a lot of effort into the analytics features of the platform. Currently we're trying out one- and two-dimensional analysis of device model populations.
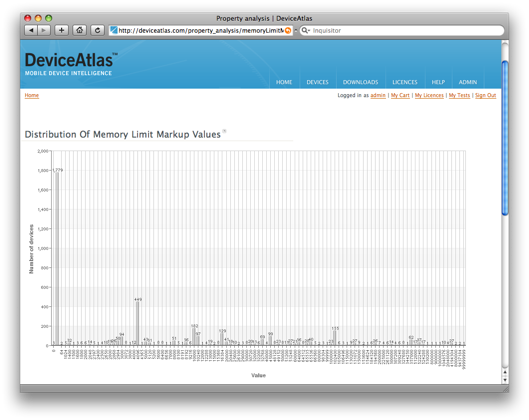
The one-dimensional tool allows you to choose any property and see the relative populations of that property's values. For example, the "memory limit" property, when projected onto such a histogram, looks like this:
In other words, of those devices for which this property is known, the majority support pages of 4 kilobytes or higher. (I think that is currently a reflection of legacy WAP devices which skew this particular chart). As you can also see, there are a reasonable number of devices for which we have not yet established this property's value.
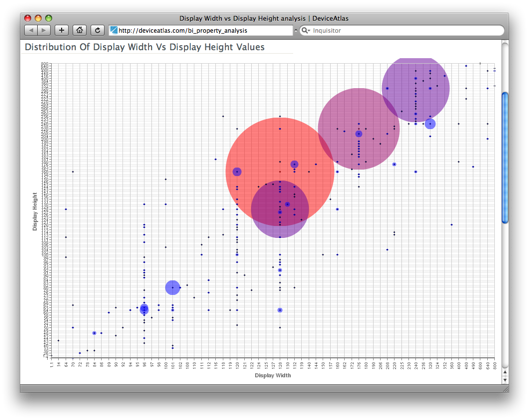
Even more interesting is the two-dimensional analysis. This lets you choose any two properties and create a bubble-chart that shows their populations against each other. A classic example, of course, is screen size:
Here, the size – and colour – of the bubbles is dictated by the number of devices sharing those two values. Immediately, it's clear from this that the most common screen size is 128px x 160px (shared by over 850 devices). Hovering over the bubble gives you stats, and clicking drills you down to a list of devices matching those criteria.
I love graphs so I think it's cool, of course. But more importantly, we think this will be very helpful for helping slice up the device landscape. Designers will be able to define common families that share similar characteristics.
(And from a site moderator's point of view, this is also a great tool for spotting data faults. Apparently there is a device with fractional screen dimensions. Hm… I think we'll fix that one.)
Anyway, we know there's plenty more to do here. No doubt we need to support user-defined filters on the dataset presented, such as geographic market. And we'd love to be able to weight the values' populations based on the popularity of real devices too (so that rarer, legacy devices don't mislead the eye).
But watch this space. We'll start to sneak this out to the public soon, and would love your feedback or comments on these ideas in the meantime.


