


In July 2015, inspired by something Mat Marquis said at TXJS 2015, I suggested that the average web page weight would equal that of the Doom install image in about 7 months time.
In about 7 months average web page size will be same as Doom install image.
Well done us! Onwards & upwards! pic.twitter.com/xtSAtZjPGl
— ronan cremin (@xbs) July 30, 2015
Well, we’ve made it, albeit a bit later than expected. This is where we are today:
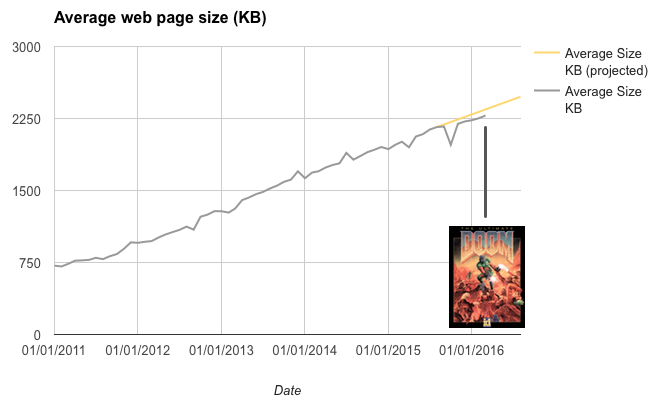
Recall that Doom is a multi-level first person shooter that ships with an advanced 3D rendering engine and multiple levels, each comprised of maps, sprites and sound effects. By comparison, 2016’s web struggles to deliver a page of web content in the same size. If that doesn’t give you pause you’re missing something. So where does this leave us?
Overall trends in page size
First, the good news. The remarkably straight line that charted the web’s creeping bloat over the years to 2015 looks to have softened ever so slightly—the slope is now slightly lower than the historical average. The bad news is that we’re still adding weight almost as fast as before.
Top performers vs. the rest
While the overall average page size is increasing inexorably, it’s worth looking at the weight of the top ten websites separately. The following chart shows the progression of the global average page weight vs. the top ten websites.
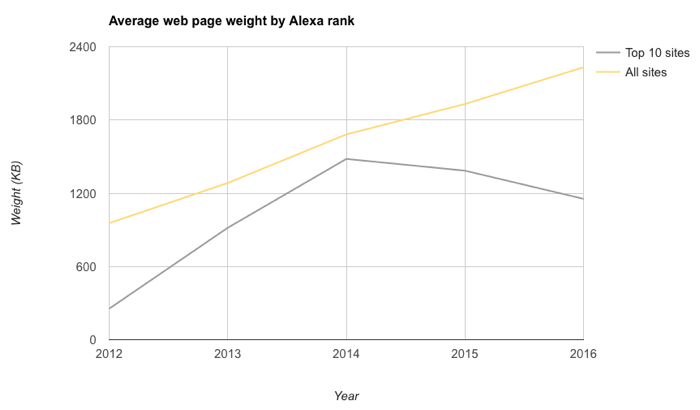
There are two points of note here.
- The top ten sites are significantly lighter than the rest (worth noting if you want to be a top website).
- While the web in general is steadily getting heavier, the top sites have turned the corner.
Readers will point out that the some of the top sites are search engines and thus they have an easier job in keeping things light but even so the second point still stands: they are getting lighter, not heavier. Note also that the top ten websites list includes some relatively rich sites such as Amazon.
Let’s start with the obvious: the transfer size is not normally distributed, and there is no meaningful “central value” and talking about the mean is meaningless, if not deceiving.
He is of course correct—in this case the average figure is overly influenced by very large outliers or, to put it another way, the desktop web in particular has a long and heavy tail (mobile web is less tail-heavy). Sometimes the median value (middle value of a series) gives a better sense of what people experience but ultimately cumulative distribution functions are the only way to accurately describe the reality.
Outlook for the web
2015 was clearly a crisis year for the web. Multiple events raised awareness of just how bad performance had gotten: ad blockers arrived on iOS; Facebook and then Google announced schemes to help make the web faster; web page bloat even made the pages of the New York Times. Vox Media (the company behind The Verge) declared performance bankruptcy.
While ads are still the web’s pantomime villain the reality is that we haven’t been paying enough attention to performance. As the web went through its awkward teenage years we let creeping featuritus take hold and eventually clutter simply got the better of us. New JavaScript gallery module? Sure, why not? Oooh that new web font would look nice here but why not add a another analytics tool while we’re in there? Should I bother resizing this 6,000 pixel image? Nah, let the browser do it, works for me.
Technology adoption sometimes follows a pattern of early experimentation → overuse → sensible long-term level. In the 1990’s when desktop publishing technology suddenly became accessible at a much lower price point thanks to PCs and cheap DTP software people went crazy—the more colours and fonts you could cram onto a page the better. It took many years for this trend to peter out and settle down to a point where creativity and user experience found their balance.
It’s clear that awareness of web performance amongst leading practitioners is now heightened sufficiently for change. But as you can see from the graphs above this awareness hasn’t yet trickled down to everyone else—the top ten websites are generally leading indicators, the rest will hopefully follow later. But changes are already well underway: WordPress’s support for responsive images in version 4.4 alone will make a big difference to the global average page size, since WordPress powers about 26% of websites; Drupal 8 has done the same by adding a responsive images module into the core.
There will be a virtuous circle effect here: as key sites improve their performance the slower ones will stand out even more. AMP and Facebook Instant Articles will serve to remind people just how fast the web can be. Google is sending ever-stronger signals how performance will affect rankings and may even add a “slow” label to sites. There is nothing like the harsh light of search engine rankings to effect change—even creeping bloat may have met its match.
Far from being doomed 2015 was the best year for the web in a long time and 2016 looks set to continue this momentum. But let’s not waste the web bloat crisis.
EDITED 20/04/2016 to add comment about average page weight
EDITED 27/04/2016 to add link to TXJS video


Leave a Reply