


Having a detailed understanding of today’s mobile landscape is crucial when making business decisions related to your online presence. Over 2016, we’ve followed DeviceAtlas’ quarterly reporting on the latest trends in the mobile device usage which are based on real life web traffic to hundreds of thousands of websites.
These reports are focused on specific device characteristics found in devices that make up that web traffic to indicate its relative popularity in various countries. Here’s a summary of some of the most significant trends we noted in 2016, including mobile OSes, non-human traffic, diagonal screen sizes, and smartphone screen resolutions.
In 2016 Android grew faster than iOS
It goes without saying that Android and iOS are now the two main opponents competing for the title of the most used mobile OS. While Android is doing much better than iOS in terms of sale volumes, if you look at the mobile web traffic share alone there are many countries where iOS dominates.
This is caused by a number of factors including the fact that Apple devices are high-end smartphones typically owned in urbanized areas which are well covered by 4G networks. At the same time, the world of Android phones is more diverse with something to offer in every price category, starting as low as $100 or less.
In early March 2016 we analyzed the web traffic share for 2015 which showed that while Android sold better, iOS share actually grew faster throughout the whole of 2015.
In 2016 this trend looked a lot different. The DeviceAtlas web traffic statistics show that iPhone sales slowed down in 2016. Market saturation is apparent in developed countries, while cost-conscious consumers, particularly from China and India, prefer cheaper options from the Android world. Here’s what the market looked like for iOS and Android across 10 selected countries during the last four quarters.
It will be interesting to see if Samsung’s issues with the Note 7 will have any impact on Android’s share in Q4 2016. A new report covering this topic will be released in early 2017.
Download the report for Q4 2015:

Up to half of web traffic may be generated by bots
Another DeviceAtlas report released in 2016 covered the share of web traffic generated by bots and crawlers. It also included the list of the most active bots.
Interestingly, bots and crawlers were the largest category of all site visits in the research which accounted for over 48% of traffic. Mobile devices generated 42.83% of hits while desktop visitors were 6.38%. 1.2% of User-Agent strings were either apps which introduce themselves as such, or junk UAs. Here is the full breakdown of the traffic by device category.
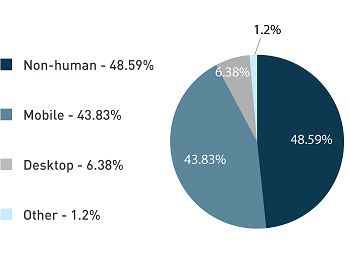
Note: Although this may sound high, it is in line with industry averages for bot-generated traffic. In some cases, bot traffic may exceed 50%.
The most active bot was Majestic-12 which exceeded the amount of traffic generated by all other bots including Google (the second most active bot), Bing, or Yahoo! Majestic-12 describes itself as a project “aimed towards building the largest search engine index on the Internet using Distributed Crawlers.”
The remaining share was generated by SEO tools (SEMrush, Linkdex, Cognitive SEO, Hubspot), monitoring programs (SiteLockSpider, monitis), social media bots (Facebook, LinkedIn, Pinterest, Twitter), bots used by phone manufacturers (Applebot, Blackberry bot), RSS tools (SimplePie), and many others.
Download the report for Q1 2016:
Screen sizes and screen resolutions
Back in 2015, we announced that 4.7-inch is now the most used mobile screen size across the globe which was based on web traffic statistics from Q3 2015.
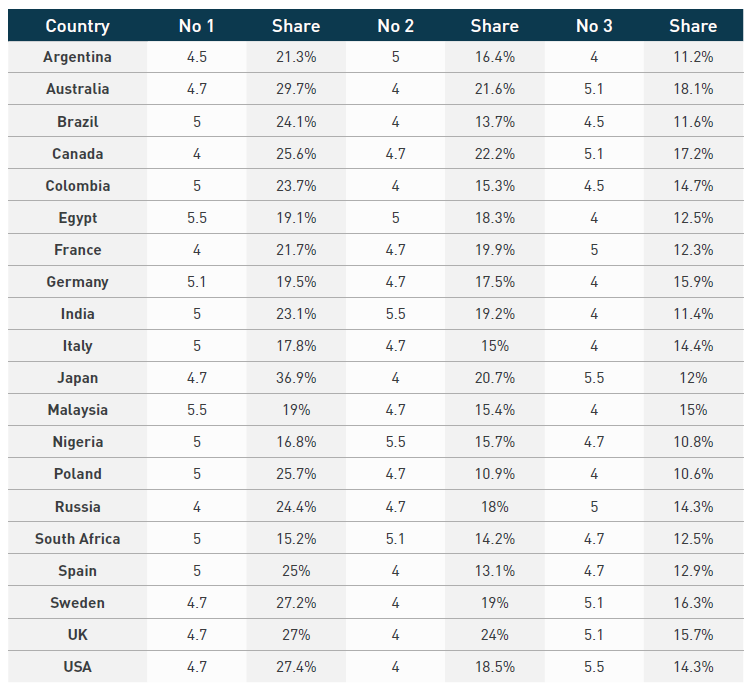
In 2016 the landscape is slightly different, given that it is now hard to highlight any single screen size dominating across all countries. Depending on the market, the most used are 4-inch, 4.7-inch, 5-inch, 5.1-inch or 5.5-inch. The table shows the top 3 screen sizes in selected local markets based on web traffic in Q3 2016.
We also noticed that the largest screen sizes are growing rapidly so we expect that their share may soon increase. Here’s a chart showing the growth of web traffic share for the 5.5-inch smartphones between Q1 2016 and Q3 2016.
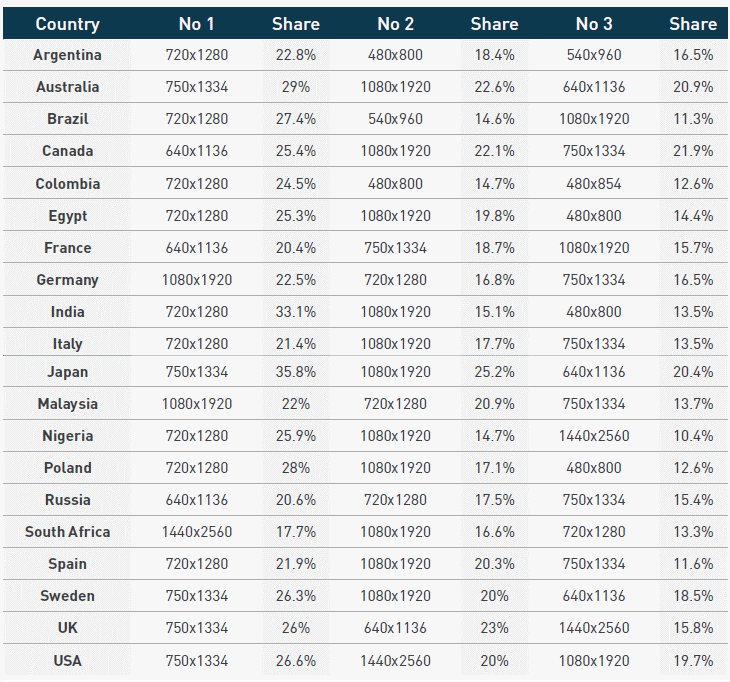
The world of mobile screen resolutions is now dominated by five different options, including 640×1156, 720×1280, 750×1334, 1080×1920, and 1440×2560. While all these screen resolutions get a large share in all countries, we believe that the 720×1280 may be considered the most popular mobile screen resolution in Q3 2016. It is used mainly in the low-end and mid-range phones where fewer pixels often mean improved battery life and generally better performance.
Download the report for Q3 2016:
Sign up to get mobile reports
DeviceAtlas launched a new page where you can download all historical mobile reports and also sign up to get the latest one directly to your inbox. A new report covering Q4 2016 will be released in early 2017 and we will cover it here on mobiForge.


Leave a Reply